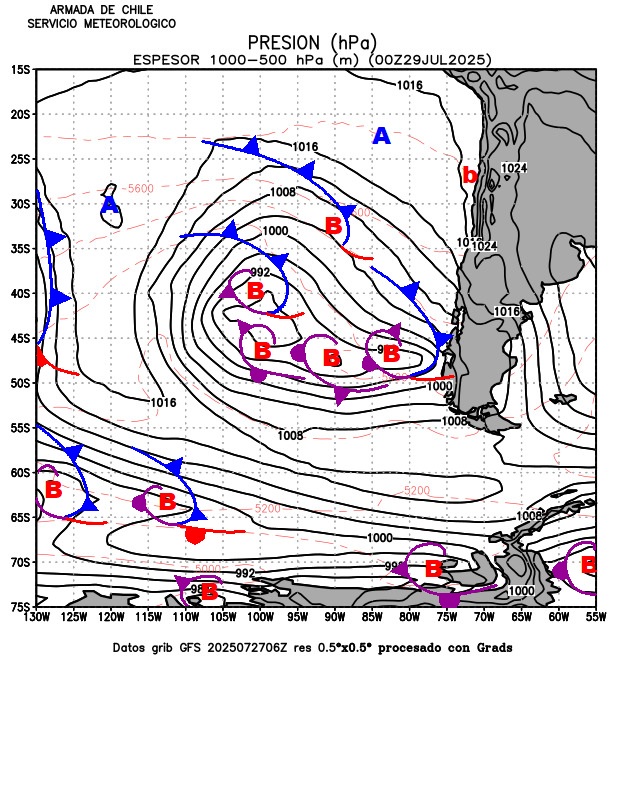
Carta Pronosticada de Superficie
Español
La imagen para la zona del Metarera XV, muestra el pronóstico a 12 horas de los campos de presión a nivel medio del mar y espesores 1000-500 hPa, obtenidos del modelo GFS con resolución 0,5 o x 0,5o grados y graficados con la herramienta GrADS. A lo anterior, se agrega el análisis aportado por un profesional quien dibuja los sistemas frontales pronosticados para ese periodo. Los valores de las isolineas de presión se dibujan cada 4 hPa y la de los espesores cada 60 metros geopotenciales.
Disponible diariamente a contar 07:00 hrs.
English
The image for Metarea XV shows the 12-hour forecast for the mean sea level pressure fields and 1000-500 hPa thickness obtained from the GFS model, with a resolution of 0.5 o x 0.5o, and illustrated using the GrADS tool. The previous is complemented with the analysis made by a professional who draws the frontal systems forecasted for that period f time. The pressure contour lines are drawn every 4 hPa, and the thickness lines are drawn with an interval of 60 meters geopotential height.
Available daily from 07:00 hrs.

