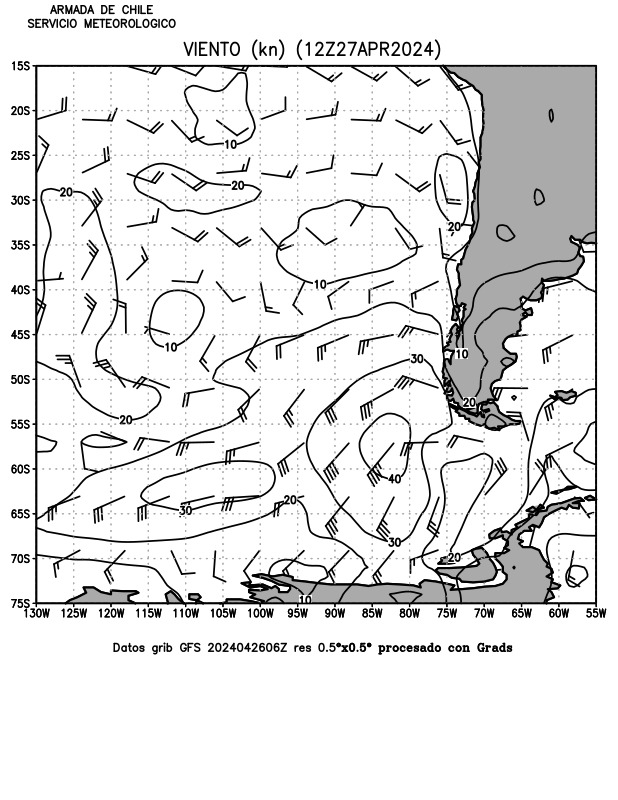
Carta Pronosticada de Viento
Español
 La imagen para la zona del Metarea XV, muestra el pronóstico a 12 horas del campo de viento a 10 metros obtenidos del modelo GFS, con resolución 0,5 o x 0,5o grados y graficados con la herramienta GrADS. Los valores de las isolineas de viento se dibujan cada 10 nds y son acompañadas con el gráfico de barbas que señala la dirección e intensidad del viento según siguiente figura.

Disponible diariamente a contar 10:00 hrs.
English
 The image for Metarea XV shows the wind field 12-hour forecast, at 10 meters, obtained from the GFS model, with a resolution of 0.5 o x 0.5o, and illustrated using the GrADS tool. The wind contour lines values are drawn every 10 knots, and go together with the barbs showing the direction and intensity of the wind, according to the figure below:

Available daily from 10:00 hrs.
